India Temperature Map
Looking at the cold wave in India currently I tried to lookup at the temperatures in the various places on the map. This was of interest to me as getting visual information of the temperatures was interesting as it showed where the cold was coming from.
My google fu was useless as the data was numeric and was simply too scattered.
Python to the rescue.
Out came a python script for collecting and plotting the data on a map of India.
The closer a temperature is to 55C the more red it is.
The closer a temperature is to 0C the more Blue it is.
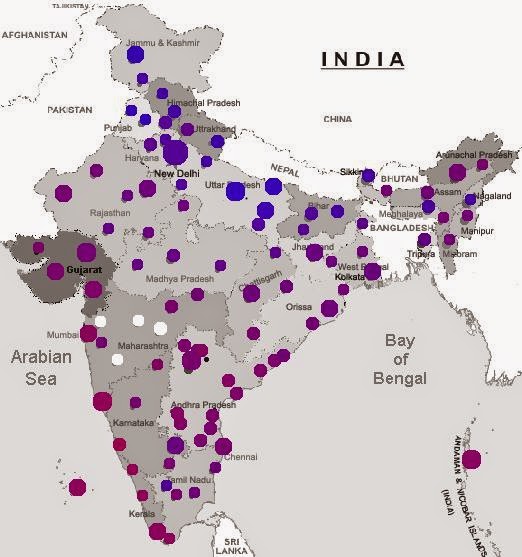
With this it is clear that the cold is coming from the "Wall in the North".
It also shows that Uttar Pradesh has been cold a lot. Mostly because it is a lot of open land and nothing to stop the wind from the Himalayas.
If you want to look at the script have a look at the Git-repo.
My google fu was useless as the data was numeric and was simply too scattered.
Python to the rescue.
Out came a python script for collecting and plotting the data on a map of India.
The closer a temperature is to 55C the more red it is.
The closer a temperature is to 0C the more Blue it is.
With this it is clear that the cold is coming from the "Wall in the North".
It also shows that Uttar Pradesh has been cold a lot. Mostly because it is a lot of open land and nothing to stop the wind from the Himalayas.
If you want to look at the script have a look at the Git-repo.
· · ·